Use employee engagement metrics to monitor change
Do you monitor employee engagement from year-to-year? In other words, do you have employee engagement metrics to track changes in employee views on the organization and their connection to it?
Like most companies, you conduct an annual employee engagement survey. Of course, the results of the survey provide lots of data. You learn about the Level of Engagement and Drivers of Engagement. But, are you able to compare engagement over the years? The survey shows it’s time for making changes. But, when you make changes, you wonder if those changes made a difference.
Surely, there must be a way to track workforce engagement changes. What employee engagement metrics should you use?
Level of Engagement and Drivers of Engagement
First, let’s clarify the two types of information collected in an employee engagement survey. They are: 1) Level of Engagement and 2) Drivers of Engagement.
Level of Engagement
The Level of Engagement items are often at the beginning of the survey. These items tend to measure the following:
- The condition of engagement. This is the presence of cognitive, emotional, and physical energy.
- The outcomes of engagement such as intention to stay or advocacy.
Drivers of Engagement
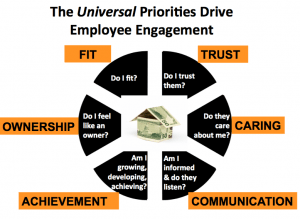
The Drivers of Engagement items on the survey measure specific aspects of the workplace. Based on research, these items drive engagement. The driver categories are, as follows: Fit, Trust, Caring, Communication, Achievement, and Ownership. These survey items aim to evaluate if the workplace has the climate needed to stimulate employee energy and connection with the company.
In the drivers of employee engagement survey analysis, you identify the “key” drivers. These key drivers become the universal Priorities for the organization. Universal Priorities are a part of the organization’s Core Culture.
Employee engagement metrics options
Once you have completed administering an employee engagement survey, you must create employee engagement metrics. Below are some options to consider for your employee engagement metrics. Some of these options focus on the Level of Engagement items. Others relate to the Drivers of Engagement items. Keep in mind, metrics are necessary to monitor what you will be trying to change.
1. Employee engagement metrics, option 1: Employee Engagement Index
The Employee Engagement Index is one example of employee engagement metrics. You calculate this metric by knowing the responses to the Level of Engagement items.
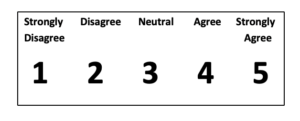
Response options in a Likert scale
To understand how to calculate this metric, first, let’s understand survey options. Typically, in a Likert scale, there are five possible responses to an item. See the image below.
Calculate three percentages

For this metric, you need to calculate three percentages. Basically, each respondent answers the Level of Engagement items. Therefore, you will put each respondent in one of three categories. Keep in mind, respondents can be anonymous. In other words, all you need to know is the responses to each of the Level of Engagement items per respondent. Thus, each respondent can be classified in one of these three categories: 1) Engaged, 2) Responsive to Engagement (or Passive), or 3) Disengaged.
Once you’ve identified the number of respondents in each category, you can tabulate the percent of survey respondents for each category.
How to compute the Employee Engagement Index
Look at the table below. You can calculate each percentage using the following guidelines:
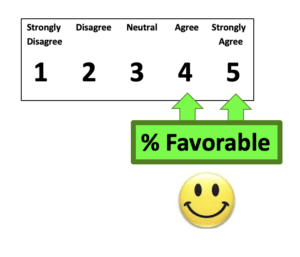
- Firstly, to be classified as Engaged: add together the percent of survey respondents who gave only Favorable top two box responses to all of the Level of Engagement items on the survey.
- These employees gave a “Strongly Agree” and/or “Agree” response to each of the Level of Engagement items.
- To be Engaged, the respondent gave no neutral or negative response to any of the Level of Engagement items.
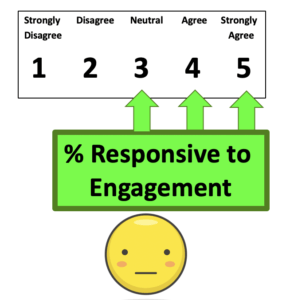
- Next, to be classified as Responsive to Engagement (Passive): add together the percent of respondents who gave a top three box response to all of the Level of Engagement items on the survey.
- These employees gave at least one Neutral response, but no Negative responses.
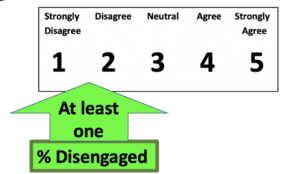
- Finally, to be classified as Disengaged: add together the percent of survey respondents who gave at least one bottom two box negative response to the Level of Engagement items on the survey.
- These employees gave at least one “Disagree” and/or “Strongly Disagree” response. So, for example, the respondent had to score at least one of the Level of Engagement items either a #1 or a #2.
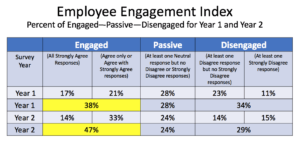
Using this process, you can calculate three numbers: percent Engaged, percent Responsive to Engagement (Passive), and percent Disengaged. As illustrated above, these three numbers provide useful employee engagement metrics. In many cases, just tracking the percent Engaged is a useful metric for monitoring Level of Engagement from one survey to the next. For example, in the above table, the Employee Engagement Index in Year 1 is 38%. The Employee Engagement Index in Year 2 is 47%.
How to compute the Employee Engagement Change Index
In the above example, you can also produce an Employee Engagement Change Index. As noted above, the percent of Engaged employees increased from 38% to 47% from Year 1 to Year 2. That means the Employee Engagement Change Index is +9%. If you monitor the Employee Engagement Change Index from year-to-year, you can track if employee engagement strategies have improved engagement.
2. Employee engagement metrics, option 2: Drivers of Engagement Category Index
This option tracks the results of the items in the Driver of Engagement categories. The six Drivers of Engagement categories are Fit, Trust, Caring, Communication, Achievement, and Ownership. Each category has several items that are measured on the survey. As mentioned above, your aim through the survey is to identify the key Drivers of Engagement. Those key drivers become your company’s universal Priorities to focus on and pay attention to with employees.
Taking each category—one at a time—calculate the percent favorable score for each item. To explain, you do this by adding the percent of respondents who scored the item either an Agree or a Strongly Agree response. Then, calculate the average percent favorable score for the category. You do this by averaging those scores.
Examples of Driver of Engagement Category Index and Driver of Engagement Change Index
Example with the Category of Fit: Fit Index and Fit Change Index
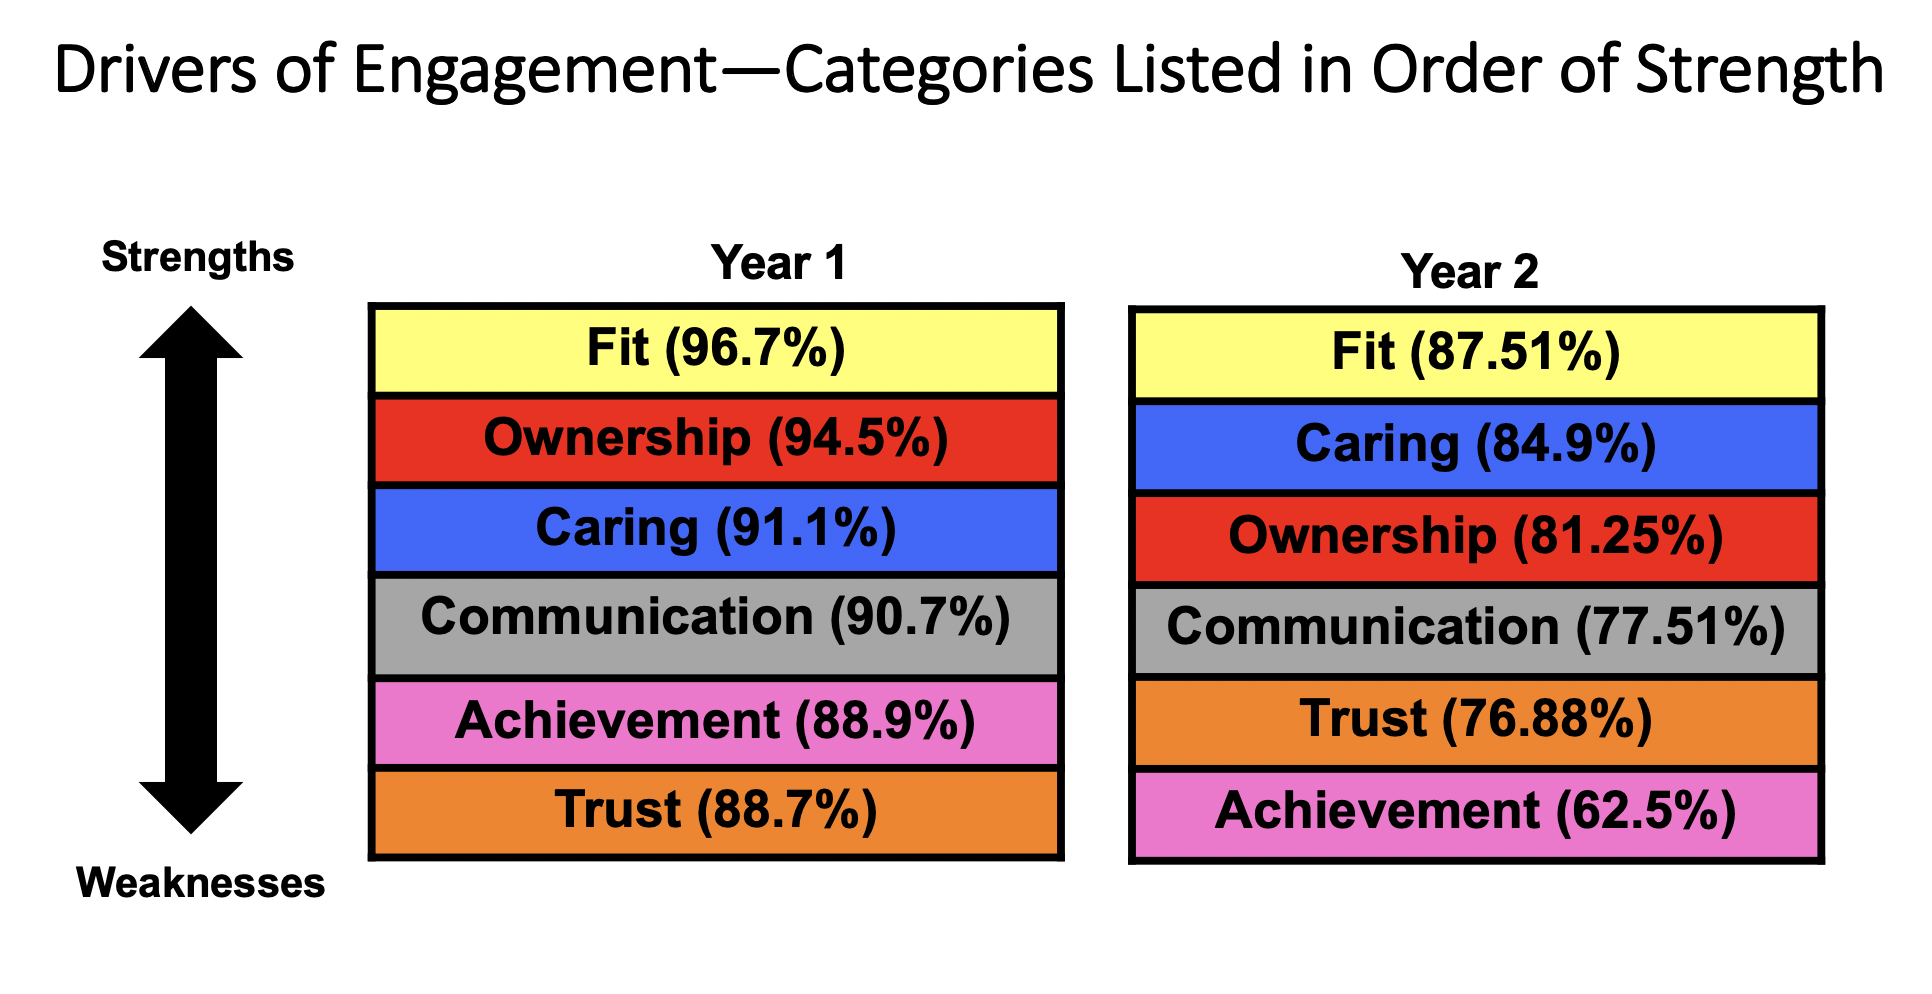
For example, let’s say the Fit category has four items on the survey that are used to evaluate Fit. If the percent favorable scores for each of the four items are 80%, 85%, 78%, and 81%, then the Driver of Engagement Fit Index would be 81%. If Fit is an area that you consider a Priority, then you would implement strategies to improve Fit. Then, at the next survey, you could determine if the Fit Index improved. If the Fit Index improved by 5%, then the Fit Change Index would be +5%.
If you do this for each category, then you will have an average percent favorable score for each category. You can monitor these metrics from one year to the next. For example, if a category in Year 1 has an average percent favorable score of 75% and in Year 2, it is 80%, then you have a positive change of 5%. The change for each category gives you your Drivers of Engagement Category Change Index to monitor from year-to-year.
Example with the Category of Achievement: Achievement Index and Achievement Change Index
In the image below, you see the average percent favorable scores for each category in Year 1 and Year 2. Each of these numbers is the Driver of Engagement Category Index. For example, in Year 1, the Achievement Index was 88.9%. What is interesting is the Change Index from Year 1 to Year 2. For example, there was an over 26% drop just in the area of Achievement. Therefore, the Achievement Change Index was -26.4%.
Monitor the Areas that are Priorities
Obviously, this metric is useful when you target a particular area as a universal Priority. For example, let’s say the survey indicates the organization has Trust issues. Therefore, the company implements changes to improve Trust. Your Employee Engagement Committee identifies and implements a number of employee engagement strategies to build Trust. If those actions are effective, then the change in average percent favorable score for Trust from Year 1 to Year 1 should go up. In other words, your Trust Change Index should be a positive number.
General Recommendations
When using this option, calculate scores for all sections. Be sure to also track changes in areas that were not a focus. The survey may reveal unanticipated improvements or areas that dropped due to a lack of focus.
Also, remember that all metrics are percentages. But, be sure to include a plus or minus before a Change Index score. You want to easily reveal the direction of the change.
3. Employee engagement metrics, option 3: Level of Engagement Item Index or Drivers of Engagement Item Index
This option looks at specific items on the survey. Sometimes, an organization will want to target items rather than a category. Therefore, you can apply this metric to the Level of Engagement items or to the Drivers of Engagement items.
For example, the Level of Engagement item “I intend to be working here a year from now” is an important metric for monitoring retention. To do this, you would monitor the percent favorable score for that item in Year 1. Therefore, if that score for Year 1 is 72% favorable, the Retention Index is 72%. In Year 2, if that item scored a 78% favorable response, then the Retention Change Index would be +6%.
In the Level of Engagement items, you can create other items to monitor. For example, you could compute Energy Index scores and Advocacy Index scores.
Now, here’s another example, but this is in the Drivers of Engagement section. Maybe an item in the Fit category such as “I love my job” scores low one year. The organization may decide to target—loving one’s job—as a year-long focus. In this case, monitoring the percent favorable score for that item from one year to the next would be an appropriate metric to monitor. In this case, if the Year 1 percent favorable score is 80%, then the Loving My Job Index would be 80%. If the Year 2 percent favorable score is 92%, then the Loving My Job Change Index would be +12%.
Note that the score for the year produces an Item Index score. In contrast, the change from one year to the next produces an Item Change Index that is a positive or negative percent.
Summary
To sum up, there are many ways to compute employee engagement metrics. Certainly, when you measure engagement, there is a greater likelihood that you will monitor it.
As you move forward, continue to provide the annual employee survey. But implementing changes is what’s necessary to improve employee engagement. And use metrics to guide you.
Now is the time to measure engagement and take action to increase it!